
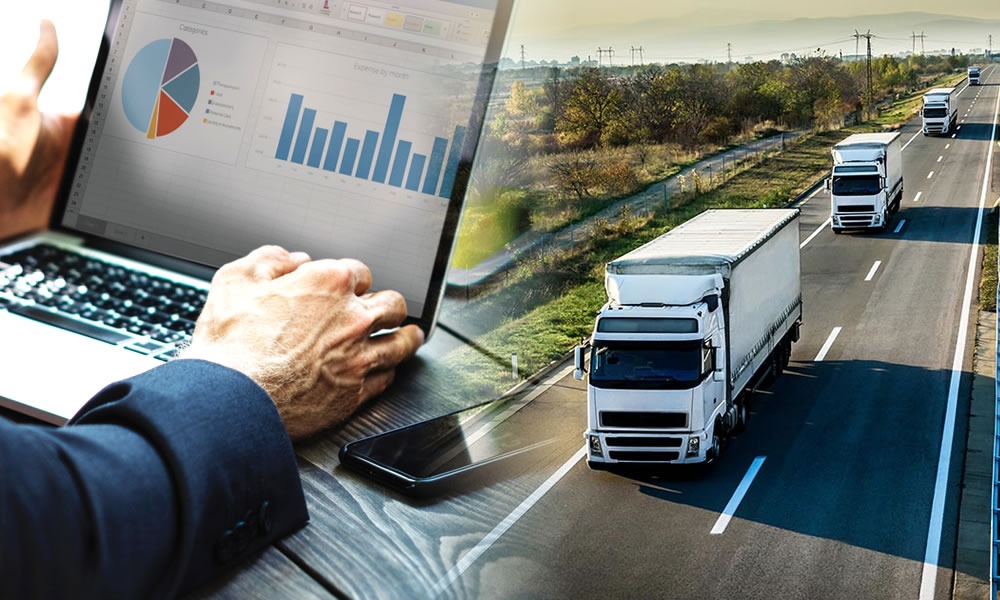
Today’s world is no longer limited to keeping fleet vehicles in good condition. Successful managers use data-driven decisions to maximize the productivity of each asset while minimizing fleet costs, risks, and environmental impacts. Fleet optimization and productivity are two central concepts for organizations’ competitive survival in the modern world. Improving productivity and optimizing fleets means running operations as efficiently as possible while reducing costs, extending asset service life, maintaining safety, and complying with environmental regulations. Without properly evaluating and monitoring these metrics, no organization can clearly understand actual fleet performance or plan improvements. This article examines what these metrics are and how to evaluate them.
What Is Fleet Optimization?
Fleet optimization focuses on the following four key areas:
- Reduce Costs: Maximize savings without compromising optimal performance or fleet asset numbers
- Improve Performance: Ensure effective vehicle use and intelligent route planning while extending service life
- Improve Safety and Regulatory Compliance: Ensure fleet efficiency through continuous incident evaluation and preventive measures
- Prioritize Environmental Considerations: Find ways to meet environmental goals and reduce emissions
Developing a practical fleet optimization strategy begins with monitoring metrics in these areas. Although environmental considerations receive less attention in Iran, the other areas also play an important role in an organization’s competitive survival. There are 10 key metrics that fleet managers must evaluate to put these four areas into practice. We examine each below:
Key Fleet Optimization Metrics
For a closer examination, we will review each fleet optimization metric across four main areas:
Cost-Related Metrics
Fuel efficiency, total cost of ownership, and maintenance cost per kilometer are the three main cost reduction metrics.
1. Total Cost of Ownership
Total cost of ownership (TCO) represents the combined long-term costs of owning and operating each asset. These include vehicle purchase, depreciation, repairs and maintenance, fuel, and vehicle downtime. Monitoring TCO helps fleets identify hidden costs and make smarter vehicle purchase or replacement decisions, maximizing each vehicle’s use throughout its lifetime.
2. Fuel Efficiency
Vehicle fuel is the largest fleet operating expense, estimated to account for half the total budget. Monitoring fuel consumption per vehicle helps fleets control costs and identify opportunities to improve performance. However, true optimization goes beyond the amount of fuel each vehicle consumes. It includes matters such as Intelligent Routing, regular vehicle tire management, Preventive Maintenance and monitoring driving behaviors such as harsh braking and prolonged engine idling.
One modern method of monitoring fuel efficiency is Fleet Optimization Software which, combined with fuel cards and based on Telematics Technology, serves as an intelligent assistant in this process.
3. Maintenance Cost per Kilometer
Understanding each vehicle’s maintenance costs relative to its distance traveled provides a clear picture of actual fleet performance, excluding other costs. Key ways to reduce these costs include implementing predictive maintenance programs and continuously analyzing each vehicle’s condition data. Monitoring maintenance cost per kilometer, rather than total vehicle maintenance costs, therefore makes it quicker and easier to reduce maintenance costs over time.
Vehicle Performance Metrics
Vehicle utilization rate and engine idling time are the two metrics in this category.
1. Vehicle Utilization Rate
This metric is the ratio of vehicle use time to its available time. A low fleet vehicle utilization rate indicates that the fleet exceeds the organization’s actual needs. Inadequate vehicle use therefore increases costs without improving transport operations. A very high utilization rate also suggests potentially higher preventive maintenance costs and shorter vehicle service lives. Monitoring this metric allows fleet managers to identify underused or overused vehicles and adjust fleet size or distribution accordingly. Optimizing utilization ensures maximum use of each vehicle and fleet efficiency.
2. Engine Idling Time
Engine idling is a hidden cost that is often overlooked, despite being a major cause of fuel waste and unnecessary vehicle wear. Monitoring this metric helps identify inefficient driving habits and fuel-saving opportunities more quickly. Based on the results, fleet managers can minimize organizational challenges by providing driver training or setting maximum permitted idling times. In modern fleets, this metric can be monitored through telematics equipment.
3. Effectiveness of Route Optimization Operations
The route optimization metric shows how effective intelligent routing plans are in saving fuel, delivering goods on time, and improving overall organizational productivity. Intelligent routing tools monitor real-time traffic data and help drivers waste less time on the road and devote that time to creating greater value. Monitoring the resulting data over time allows their impact on fleet optimization to be assessed.
Safety and Regulatory Compliance Metrics
Accident frequency and vehicle inspection compliance are two important aspects of this category.
1. Accident Frequency
Monitoring accident frequency is crucial to improving overall fleet safety. This metric tracks the number and frequency of accidents and helps fleet managers identify patterns or risk factors relating to Driver Behavior, vehicle condition, and road damage. Accident frequency is calculated by dividing the average interval in days between accidents by the vehicle’s total operating days.
2. Vehicle Inspection Rate
Monitoring vehicle inspection rates helps fleet managers identify problems before they worsen and prevent costly breakdowns. Promoting a culture of thorough, regular inspections ensures that fleet vehicles remain in the best operating condition and reduces downtime.

Environmental Impact Metrics
This metric is particularly important in developed countries where vehicle emissions are subject to fines. Nevertheless, examining it at the end of this article helps expand knowledge and provide up-to-date information in this area.
1. Emissions Level
Monitoring each vehicle’s emissions helps identify opportunities to reduce the fleet’s negative environmental impact. Using cleaner fuels, renewing vehicles, and reducing idling are all part of implementing this metric. In developed countries, a combination of fuel cards, telematics technology, and Fleet Management Software is used to continuously monitor each vehicle’s emissions.
2. Percentage of Environmentally Friendly Vehicles
The percentage of green or environmentally friendly vehicles measures modern fleets’ commitment to environmental challenges. Using electric and hybrid vehicles in a fleet reduces the negative emissions effects of conventional vehicles and lowers operating costs over the long term.

How Do We Evaluate Fleet Optimization Metrics?
Fleet optimization and productivity improvements are impossible without accurate data and measurable indicators. Metrics such as fuel consumption, vehicle utilization, safety, and total cost of ownership demonstrate their value when monitored and evaluated continuously. In this process, using a Integrated Fleet Management Software plays a key role in monitoring data and turning it into practical actions. Through intelligent solutions based on this software, Pishgaman Asia gives organizations a distinctive opportunity to manage fleets with greater insight. Fleets can therefore move beyond traditional decision-making and consciously rely on analysis of key metrics from the intelligent Fleet Management system. They can reduce costs while maintaining safer fleets with maximum productivity. Simply make a call and Get a Free Consultation to begin this journey.
Source